What Did We See?
- U.S. Large Cap stocks, or the S&P 500 index, were up almost 9 in Q3.
- The developed markets of Japan was up more than 10%.
- Europe was up about 2%, the U.K. down almost 3%.
- Emerging Markets were up almost 10% and Asia (Ex-Japan) were up almost 11%.
- Global fixed income returns were all positive in the quarter.
Where Do We Stand?
- The market rally continued but now looks to the looming presidential election and increased volatility.
- Valuations remain extremely stretched while growth looks set to stall.
- I remain in a position of avoiding overweights to higher risk areas while maintaining an allocation to large, quality equities.
- I continue to rebalance your accounts accordingly and have been selectively waiting to put more cash to work in portfolios.
[sonaar_audioplayer title=”Click here to listen to the Market Update!” albums=”2590″][/sonaar_audioplayer]
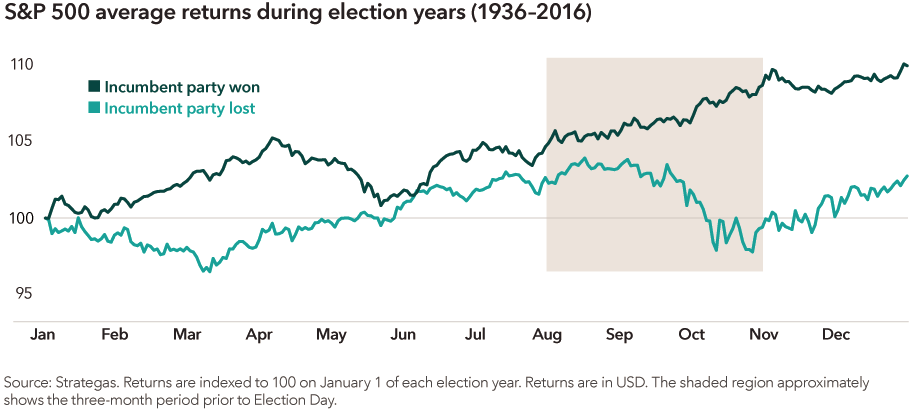
As we begin the fourth quarter of 2020 markets appear poised for the typical bouts of volatility that election years have entailed. Historically the stock market has been a pretty solid indicator of forthcoming presidential election results. If the S&P 500 is up in the three months prior to Election Day, the incumbent candidate usually wins. This metric has been right in 20 of the last 23 elections since 1936. This happens because the stock market tends to always look ahead.
When the economy is strong there is usually less reason to change leadership and the market doesn’t need to discount the uncertainty that such a change in leadership entails. When the economy is weak and the political climate challenging, the market tends to discount a looming change in government policies.
A Different Year
Since August 3rd through September 30 the S&P 500 is up about 2%. In a normal year this would slightly favor the incumbent. However, 2020 has been anything but normal. Since 1912, incumbent presidents that have experienced a recession within two years of an election have been voted back in only once.
More importantly to consider, elections tend not to be something long term investors should try to trade. Whether or not the incumbent wins or loses, the volatility around elections tends to be short lived as you can see on the chart below.
Growth Stall
As the world continues to grapple with the effect of a pandemic, markets continue to look for a way out. Economically, the shifts we have experienced in the utilization of capacity will take several quarters to unwind. This leaves us in an economic state that is not conducive to job creation, wage growth or profit growth. Some may call it a “gradual recovery”. I call it a stall. Economic output for the US will likely not return to its pre-pandemic levels until late 2021. This is because consumption drives almost 70% of our economy.
With service businesses only partially re-opened (and possibly closed again as the virus enters the dangerous flu season) and high unemployment remaining, we find ourselves in an environment not conducive to growth. Recessions need to grow out of themselves and we have no growth nor the means to grow right now.
Half a Recovery
The pandemic caused the loss of about 22 Million jobs in the US. By the end of the third quarter we have recovered about 10.6 Million of those jobs. Although the S&P 500 is trading at or near levels seen before the pandemic struck, we are not out of the woods yet. We have only economically recovered by a half.
I would expect this second half of the jobs recovery to be much slower and take much longer than the first. Furthermore, the economy’s ability to produce jobs has also been impaired. Many small businesses have gone bankrupt or closed permanently. New businesses are not born overnight and the entrepreneurial fire needed to do so may take some time to re-kindle.
Still Overvalued
From a valuation perspective the market appears overvalued. At the end of the quarter, the Forward P/E (Price to Earnings Ratio) on the S&P 500 stood at around 21.5x. The 25 year average is about 16.5x. One of the main reasons for this distortion is that the forward P/E looks at EXPECTED earnings over the next 12 months. Obviously, the expected earnings over the next 12 months are extremely depressed due to the steep recession we have experienced. Other measures of valuation appear to look better, albeit still higher than normal levels.
Winners and Losers
This quarter also saw a divergence in returns from a geographic perspective as well. Asian economies seem to be much further along in their recoveries while Europe, the U.K. and the U.S. tend to be a few paces back. For example, China’s subway usage is now only 10% below the level in 2019 while the U.K. remains 60% below their 2019 levels.
The previous fiscal stimulus in the U.K. and the U.S. has run it’s course. The new scheme in the U.K. is much less generous than the first and the scheme in the U.S. is likely to be less generous as well. Europe extended their measures at the same levels as before. This all speaks to a lumpy, slow recovery within most of the developed world.
Looking Forward
When taking into account the higher than normal level of valuations, the short term inability of the economy to fully recover jobs, the ongoing pandemic and the inherent volatility around elections one can expect a fourth quarter of higher than normal volatility. This doesn’t necessarily guarantee a drastically lower market here in the U.S., however.
The specter of extremely low rates and monetary support from the Federal Reserve remains. Additionally, there is a looming potential for another round of fiscal stimulus. Any amount would help although the two sides continue to be rather far apart.
Our Portfolios
After this period of uncertainty we would expect to feel more comfortable putting money to work. By January we should know many things including the result of the U.S. election, the details of Brexit, the size of the U.S. fiscal package and potentially good news on a vaccine. Until then we remain well diversified across asset classes and securities with cash on hand to take advantage of areas that have not fully participated in the recovery.
If you have any questions or have experienced any changes in your financial situation please do not hesitate to Contact Me.
We appreciate you being a part of the Shorepine Wealth Management family!
Investment Products are Not FDIC Insured. No Bank Guarantee. May Lose Value. Investing involves risk. All written content on this website is for information purposes only. Opinions expressed herein are solely those of Shorepine Wealth Management, unless otherwise specifically cited. This is neither a solicitation of offers to buy securities nor an offer to sell securities. Past performance is no guarantee of future results. Material shown here is believed to be from reliable sources however, no representations are made by our firm as to another parties’ accuracy or completeness. All information or ideas provided should be discussed in detail with an advisor, accountant or legal counsel prior to implementation. Shorepine Wealth Management, LLC is a registered investment adviser offering advisory services in the State of California and in other jurisdictions where registered or exempted.