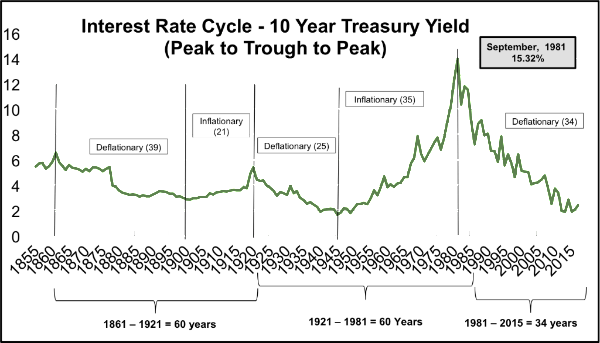
Asset markets tend to adhere to longer term relationships. Since the industrial revolution several of these cycles have stood the test of time. The primary cycle that drives most economic activity is the interest rate cycle. Interest rates determine if the economy has the ability or fuel to grow when conditions are right. They also determine if the economy (and inflation) will slow down. The Federal Reserve sets interest rate policy but is a reactionary device as to what is actually happening in the broader economy. Simply put, if the economy is overheating (growing too fast) to the point of driving inflation higher (inflation can be a “bad thing”), the Federal Reserve’s job is to slow it down. If the economy is lagging and unemployment is rising, the Federal Reserve’s job is to give it the fuel to grow. The common gauge for interest rates in the US is the 10 Year Treasury bond yield. Interest rates tend to follow a 60 year cycle. That is from trough (low point) to peak (high point) and back down to trough (low point). The cycle is never EXACTLY 60 years and the midpoint of the cycle is never EXACTLY 30 years. Since the cycle is so long the exactitude of the cycle is moot. The important thing is that the relationship has been consistent. See the chart below.

Within this long interest rate cycle equities and commodities tend to have their own, shorter secular cycles.
A secular cycle is different from a cyclical cycle and now might be a good time to explain the difference. Secular cycles last over longer time periods than cyclical cycles. Think of a cyclical cycle as the same as an economic cycle. Economic cycles tend to be tied to the growth in the general economy and these economic cycles tend to last 3 – 5 years. Historically, after a 3 – 5 year period of strong growth in the economy the federal reserve steps in to try to slow inflation. Vice versa, when the economy has lagged for a few years policies tend to push towards growing the economy. Also to note is that the middle of 3 – 5 years is 4 years, the Presidential election cycle. Alternatively, the secular cycle is much longer and cannot be controlled by interest rates (Federal Reserve) alone. Secular cycles tend to be driven by demographics (baby boomers, Gen X, Millennials), Credit (the availability of and demand for credit) and valuation (if the market is too cheap or expensive). These secular cycles tend to last 10 to 15 years and each has its own characteristics.
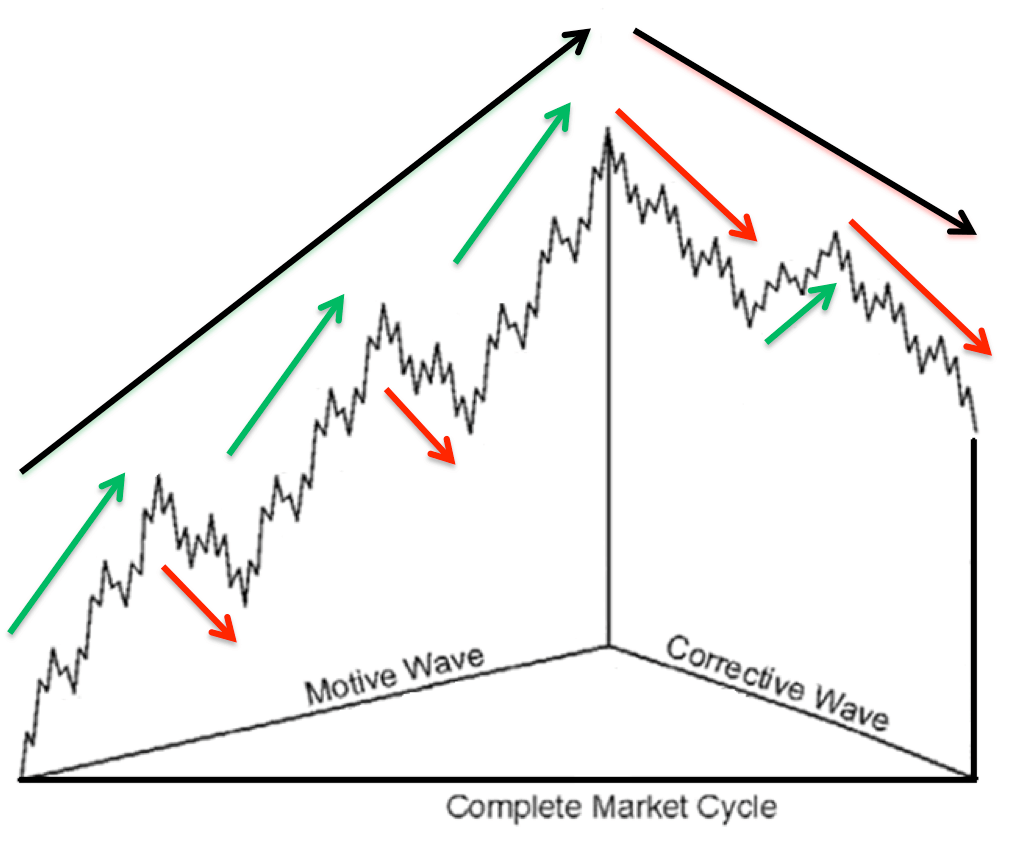
For our purposes today, let’s focus on the equity secular cycles. See the chart below.

 In theory this is what a normal cycle looks like. The green and red arrows are the cyclical cycles (3 – 5 years). The black arrows are the secular cycles (10 – 15 years). When the secular cycle is bullish (large black arrow on left side, a.k.a: motive wave) notice the nature of the cyclical cycles. The bullish cycles (green arrows) are longer and stronger and the bearish periods (red arrows) are shorter and weaker. Contrast that to the right half of the complete market cycle. In the “corrective wave” (another way of saying “secular bear market”) the bearish periods (red arrows) are longer and stronger and the bullish cycles (green arrows) are shorter and weaker. Note that even the up cycles have periods of negative returns and the down cycles have periods of positive returns. Of course, the true equity markets never follow this exact course as so cleanly depicted here. However the tendencies have been pretty consistent. So where do these observations leave us?
The Four Secular Equity Cycles
If the interest rate cycle last about 60 years then it makes sense that within each interest rate cycle there should be 4 different secular equity cycles of about 15 years each. During two of these secular cycles interest rates will be rising and during the other two secular cycles interest rates will be falling. The direction of interest rates alone will determine how the economy and markets act. In rising interest rate environments financing costs are higher and rising, while input costs are likely to be higher and rising as well. It is harder for companies to make a profit and the need for efficiency is very high. During falling interest rate environments the reverse is true. This leaves us with 4 distinct secular equity cycles.
Deflationary Bull
The deflationary bull market is one in which interest rates are falling while the equity market is experiencing a secular bull market. There have been two of these on record 1920’s to 1930’s and 1980 – 2000. A term coined by Alan Greenspan perfectly defined these eras. “Irrational Exuberance”. These periods are defined by the following:
- Free money – extreme levels of leveraging and borrowing at low rates.
- Falling input costs – leading to high and increasing profit margins.
- Misallocation of resources
- Ends with a bang
Deflationary Bear
The deflationary bear market occurs during the second half of a 30 year interest rate deflation cycle. These cycles come after the extreme exuberance of the prior cycle and like a bad hangover, they linger. 1930 – 1940’s and 2000 – 2013 have been deflationary bears. The period is defined as “Irrational Discouragement” because although interest rates are still low and going lower, no one wants to experience the loss that occurred at the end of the deflationary bull. These periods are defined by the following:
- There is an immense amount of deleveraging.
- Structural unemployment and social unrest.
- Broken business cycles
Inflationary Bull
The inflationary bull market is likely where we are now*. There have been two other prior to this, 1880 – 1900 and 1940 – 1960. These markets are defined as “Rational Exuberance”. There is exuberance because the prior bear market and its structural unemployment is over. There is rationality because input costs and interest rates are rising. This leads to these periods being defined as:
- Flat to rising input costs
- Flat to rising interest rates
- Efficient allocation of resources
- Low participation (low volumes)
- Ends quietly
- Strong cyclical bulls, weak cyclical bears
*Although many believe the current “bull market” began in March 2009, that is just not the case. Bull markets begin when they eclipse the prior bull market highs. That occurred in the spring of 2013.
Inflationary Bear
The inflationary bear market is not one to be taken lightly. There have been two, 1900 – 1920 and 1960 – 1980. These are periods of “Rational Discouragement” and oftentimes include periods of stagflation (inflation with little or no growth in the economy). So while your costs of living are going up, there is no more income to offset them. These are periods defined by:
- High and rising financing costs (interest rates)
- High and rising input costs (low margins)
- Flat equity markets
- Stagflation
- Weak cyclical bulls, strong cyclical bears.
Where are we?
Although the change in interest rates from falling to rising likely occurred in 2015 and tested lows again in 2016, the equity market did not sync up exactly with the shift. The equity market broke out of its secular bear market almost two years earlier in 2013. This is relatively normal as the market is an anticipatory device and often leads other markets and indicators. Needless to say, we are very likely out of the deflationary secular bear market that began with the dot-com bust in 2000 and included the credit and real estate implosion in 2008 and the market bottom in 2009. This cycle ended when the markets regained the prior high in 2013. Thus, the “bull market” is only 4 years old. Has it gone pretty far? Absolutely. But if we are indeed in an inflationary bull market we should have more room to run. The drivers of demographics, credit and valuation all seem to be reasonable enough to continue the trend. Let’s examine each more closely.
Demographics
The demographic situation is very strong. Millennials are a larger group in total than the baby boomers were. There are about 85 – 90 million millennials to the baby boomer generation at about 80 million. These millennials are now of the age to have families and are coming into their peak spending years. This is a driving force behind our economy for years to come.
Valuations
Valuations are not cheap, but they are not market peak expensive either. The market currently trades at around the mid teens on a forward Price to Earnings basis. (P/E is a measure of the market’s valuation level). Markets tend to bottom at around a 9 or 10 P/E while the market top in 2000 saw a P/E of around 27 times. It is right around its 20 year average but well above the 5 and 10 year averages.
Credit
Credit has become harder to obtain but the private sector has done a miraculous job of deleveraging their balance sheets since the credit implosion of 2008. The private sector is poised to borrow once conditions warrant.
Taken holistically it would seem that the market is not in as precarious a position as many would warn you. Certainly the market has had an incredible run of late and a resetting of expectations and a healthy pullback is not unwarranted. However, for the longer term investor these shorter and weaker pullbacks during a secular bull market are best viewed as opportunities to rebalance or put savings to work as opposed to a reason to “run for the hills”.
As always, we welcome and encourage your feedback or questions. It is a pleasure to work with you.
*Much of the long cycle analysis work here is attributable to Dan Wantrobski, CMT
* Interest rate chart data from US Treasury.
* Equity cycle chart is a commonly used Elliott Wave pattern to depict market action.
Investment Products are Not FDIC Insured. No Bank Guarantee. May Lose Value. Investing involves risk. All written content on this website is for information purposes only. Opinions expressed herein are solely those of Shorepine Wealth Management, unless otherwise specifically cited. This is neither a solicitation of offers to buy securities nor an offer to sell securities. Past performance is no guarantee of future results. Material shown here is believed to be from reliable sources however, no representations are made by our firm as to another parties’ accuracy or completeness. All information or ideas provided should be discussed in detail with an advisor, accountant or legal counsel prior to implementation. Shorepine Wealth Management, LLC is a registered investment adviser offering advisory services in the State of California and in other jurisdictions where exempted.


